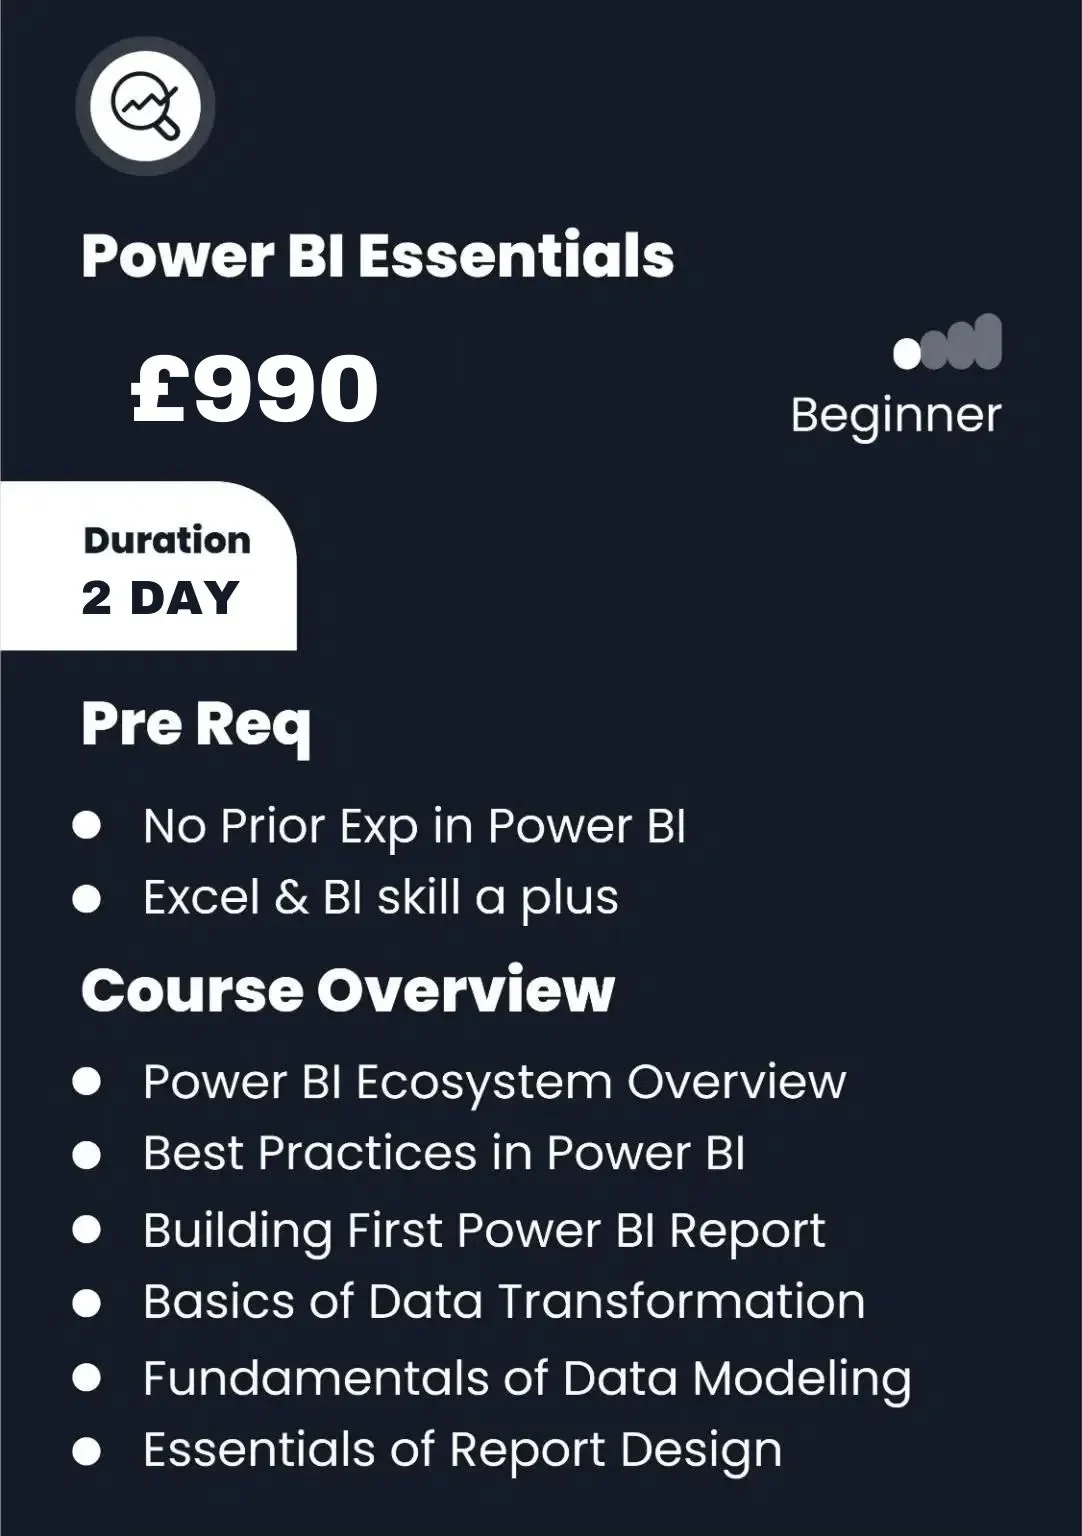
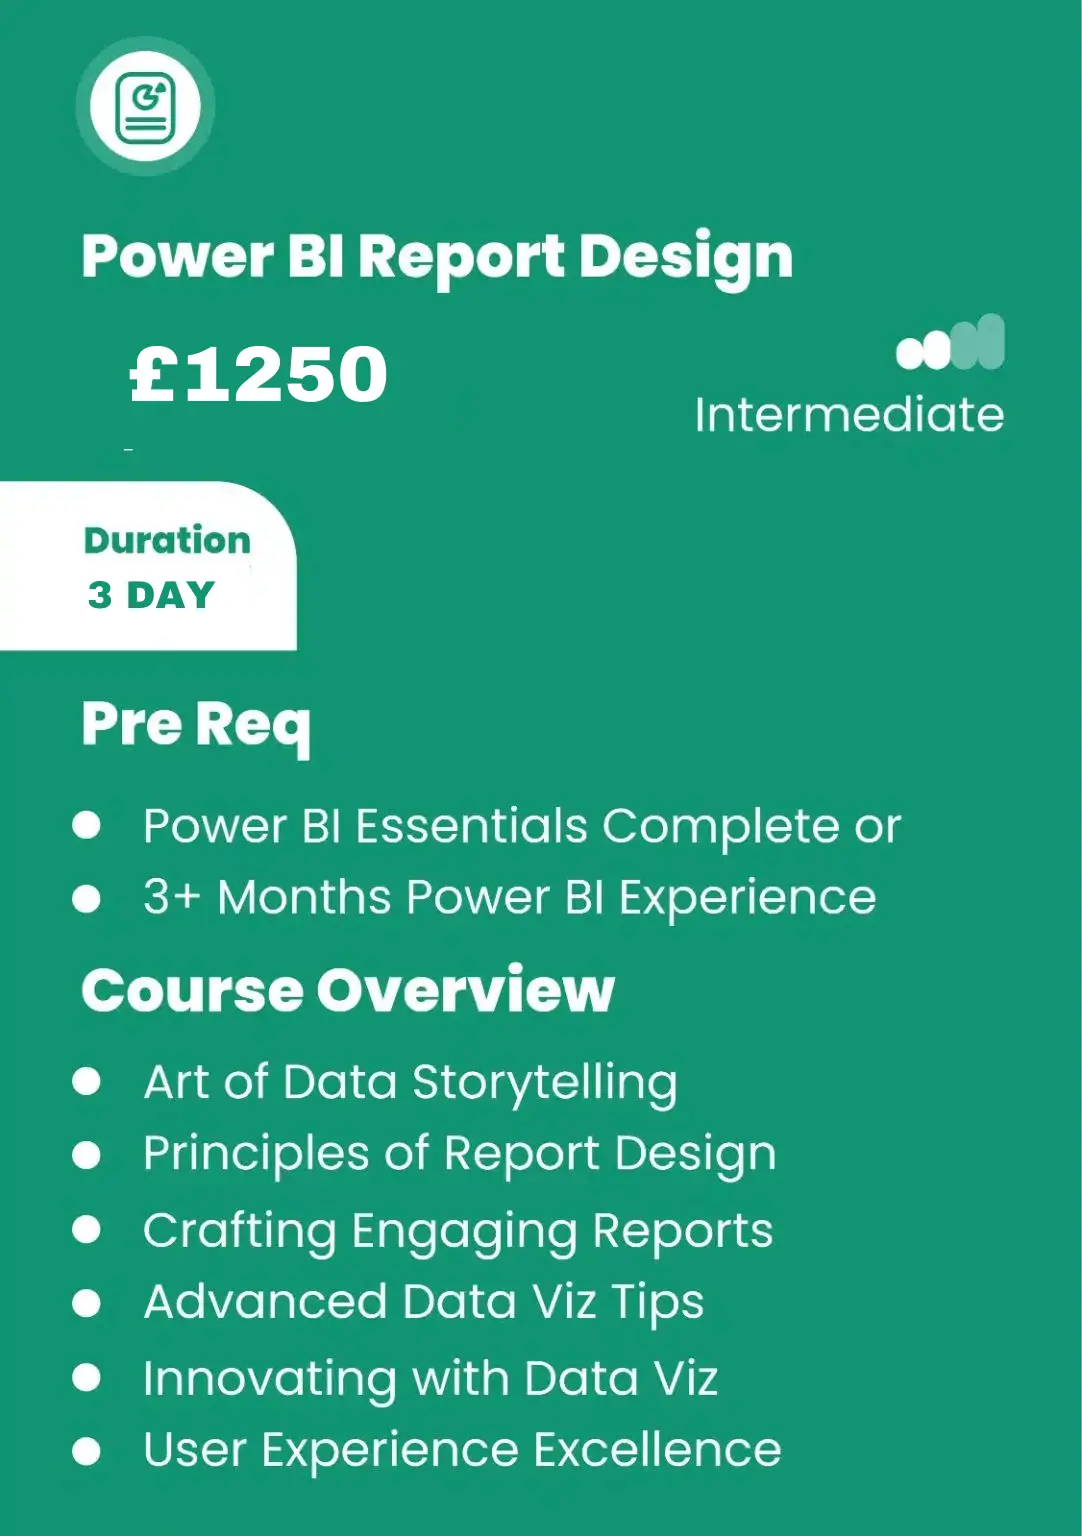
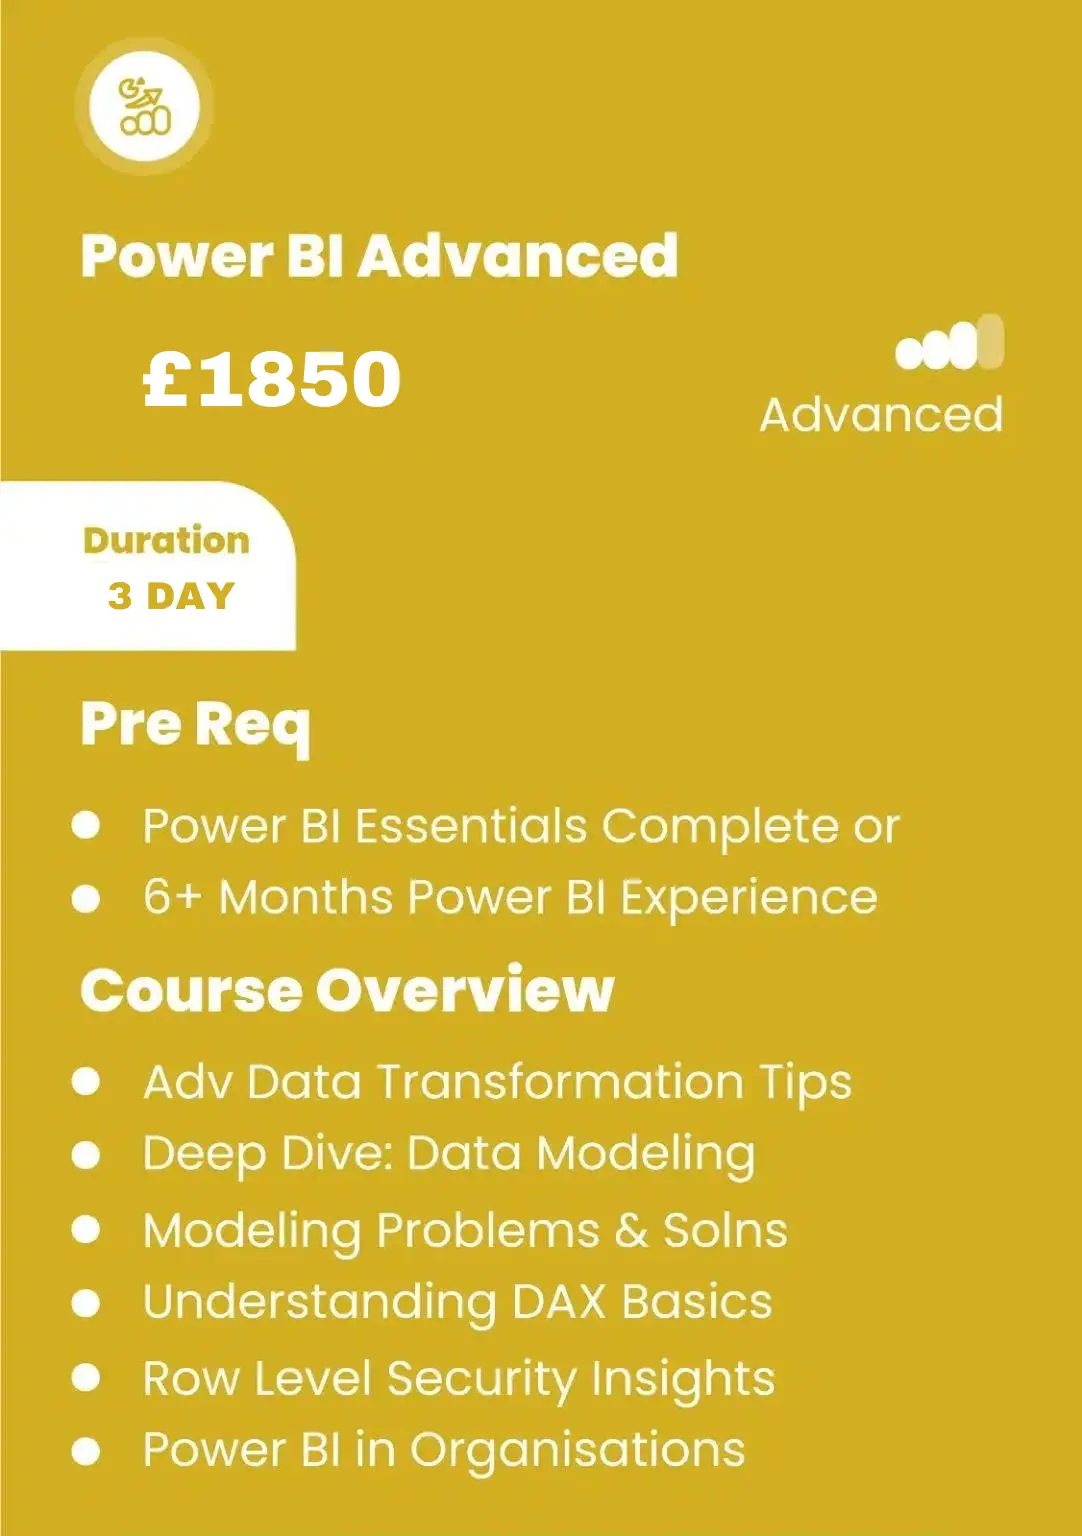
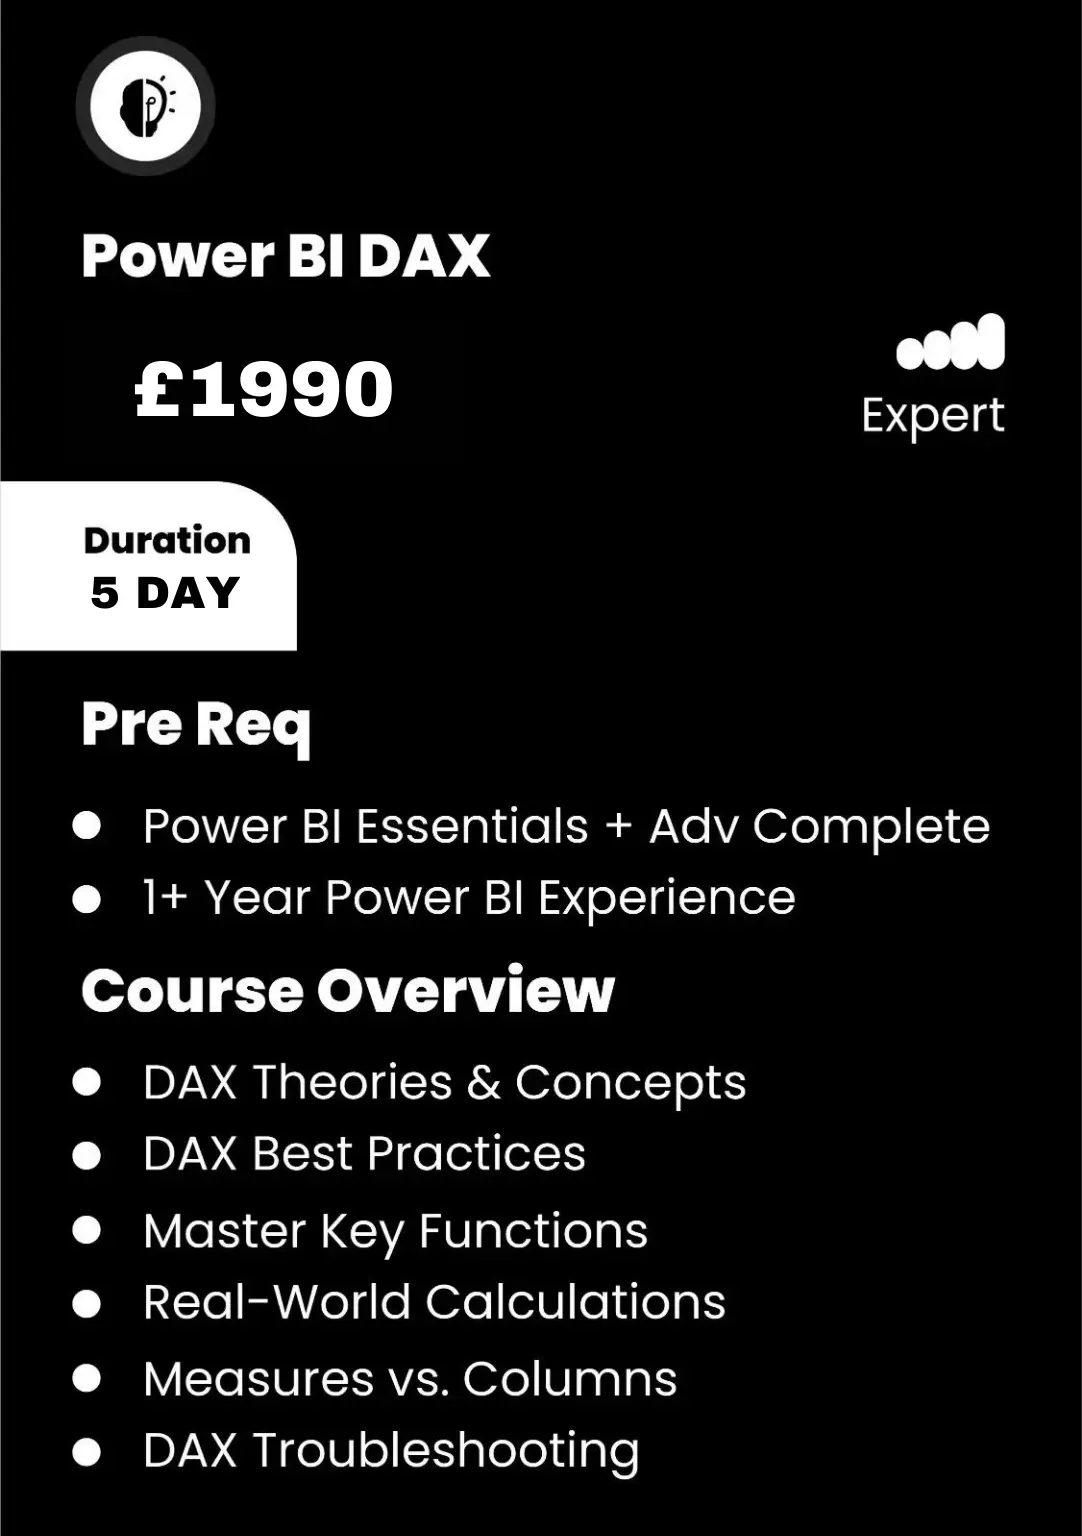
Power Bi Training Courses London UK

Interactive
Power BI Dashboard

Use Power BI dashboards to get a comprehensive snapshot of your business’s key indicators. Identify trends, locate areas for improvement, and guide your business towards continuous growth with informed decisions.

Here’s a Power BI dashboard example created by our experts for you to interact with:

Empower your Decision-Making with Power BI Dashboards

In today’s fast-moving business world, quickly gathering insightful data and acting on it is key. Interactive Power BI dashboards are leading the charge, providing a vital resource for businesses aiming to flourish. These dashboards shine in discovering hidden patterns, analysing extensive data sets, and presenting them through engaging visualisations, establishing themselves as essential for any business focused on growth.

Interactive Power BI dashboards simplify complex data, making insights accessible and actionable. Suitable for companies of any size, from startups to global enterprises, these dashboards offer customisable options and instant analytics. This flexibility ensures you can stay updated with your operations, understand your metrics more clearly, and make strategic decisions promptly.

Power BI Dashboard Features

  1. Engaging Visuals
    Explore your data with Power BI’s engaging visuals. These features allow for an active exploration of your data, making it straightforward to find insights, observe trends, and pinpoint outliers. This interaction enhances the user experience, leading to informed decisions that contribute to business growth.
  2. Instant Data Insights
    Keep a step ahead with instant analytics. Power BI dashboards enable you to track key metrics in real time, ensuring you’re always well-informed and ready to adapt to any business changes quickly.
  3. Tailored Dashboards
    Design your Power BI dashboard to meet your specific business requirements. With wide-ranging customization choices, you can display your data in a manner that speaks to your team, making sure the insights inspire action throughout your organisation.
  4. Unified Data Integration
    Combine data from various sources with Power BI’s strong integration features. This consolidation offers a unified view of your operations, aiding in discovering deeper insights and making strategic decisions.
  5. Accessibility Anywhere
    With mobile access, Power BI dashboards ensure you’re always connected to your data, no matter where you are. Make knowledgeable decisions on the move, keeping your business nimble and responsive.

Integrating Power BI Dashboard into your Workflow

Power BI dashboards smoothly integrate with various Microsoft tools, such as Excel, SharePoint, Teams, Dynamics 365, and Azure. These integrations amplify your data’s power, enabling richer insights and a more integrated data-driven strategy.

Getting Started with Power BI Dashboards

Creating a Power BI dashboard is a structured process, involving data organisation, visualisation design, and dashboard dissemination. Start with arranging your data, then create compelling visualisations that narrate your data’s story. Finally, make sure your data is refreshed regularly and share your insights to empower your team.


If you’re looking for more personalised courses, consider our top-tier training courses led by industry experts dedicated to empowering you with the knowledge and tools to master Power BI dashboards.

TRUSTED BY TOP COMPANIES

Contact Us

Kindly submit your details and a training consultant will contact you shortly.